
The Custom Chart screen allows you to create and save custom charts. A custom chart can show any of the supported statistics and their change through time. With Custom Chart you can even plot two variables on the same chart.
In the upper part of the main window you select the data for the X-axis (Hands, Day, Week, or Month) and the statistics to be plotted. For example, you can choose Hands (number of hands in fact), Total winnings as the first variable and Rake paid as the second. Here is the corresponding chart:
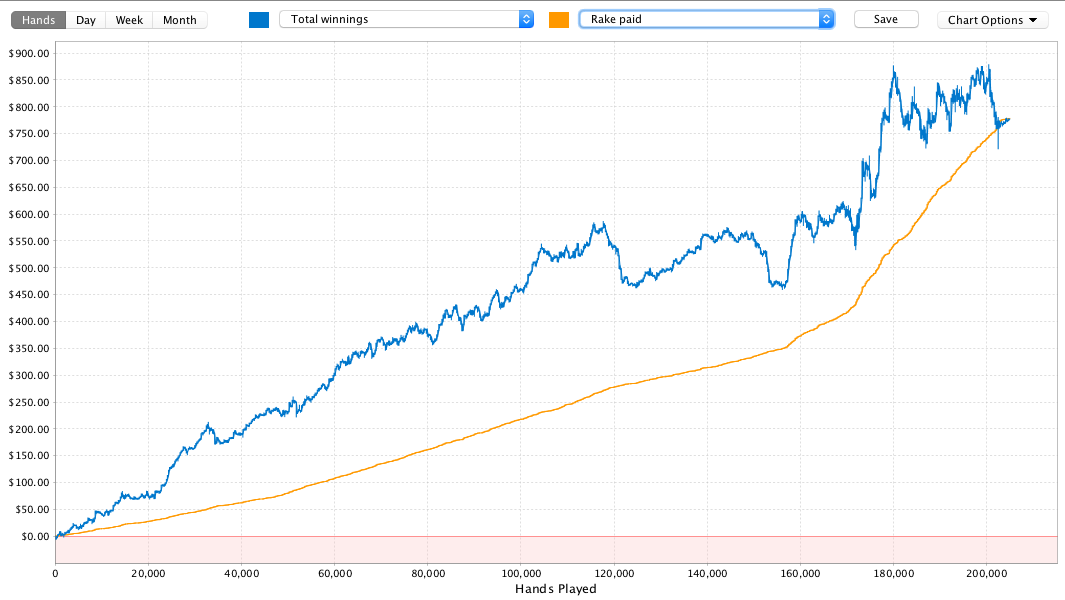
Comparing the evolution of 2 statistics lets you corner down potential leaks in your game. For example, analysing the combined evolution of PFR (preflop raise) and CBET (continuation bet on the flop) on the same chart or PFR and 3B (three bet preflop) may lead to interesting conclusions.
Note that total winnings is expressed in number of chips won for tournaments and in your poker room’s currency for ring games.
You can save a custom chart with the Save button on the right side of the bar. Saved charts will be listed in the sidebar, with a name automatically generated based on the chart’s contents.
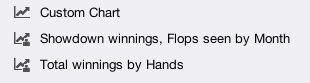
Saved charts appear in the sidebar. Here is our example chart added to the sidebar:
You can delete a saved chart. Choose the chart in the sidebar and right-click to see the context menu:

Need more help with this?
Don’t hesitate to contact us here.